


Opening a cryptocurrency exchange for the first time can feel like staring into the matrix. Flashing numbers, red and green bars, and strange lines zig-zagging across the screen are enough to intimidate anyone. However, learning how to read crypto charts for beginners is one of the most valuable skills you can develop as an investor.
A chart isn’t a crystal ball that predicts the future, but it is a visual map of market psychology. By understanding the basics of technical analysis, you can stop guessing and start making calculated, data-driven decisions.
In this guide, we will break down the anatomy of a crypto chart, explain how to read Japanese candlesticks, and show you how to spot basic market trends.
1. The Anatomy of a Crypto Chart
Before diving into specific patterns, you need to understand the basic layout of a trading screen. Whether you are using Binance, Coinbase, or a dedicated charting tool like TradingView, almost all crypto charts share the same foundational elements:
- The X-Axis (Time): Running along the bottom of the screen, this axis represents time. Moving from left to right moves you forward in time.
- The Y-Axis (Price): Running up the right side of the screen, this axis represents the current price of the cryptocurrency.
- Timeframes: You can adjust the chart to show different time blocks. In a 1-Day (1D) chart, each data point represents 24 hours. In a 15-minute (15m) chart, each point represents 15 minutes of trading activity. Beginners should stick to higher timeframes (like 1D or 4H) to filter out short-term market noise.
2. How to Read Candlestick Charts
While line charts are great for seeing the “big picture,” most crypto traders use candlestick charts because they provide much more granular data about price action within a specific timeframe.
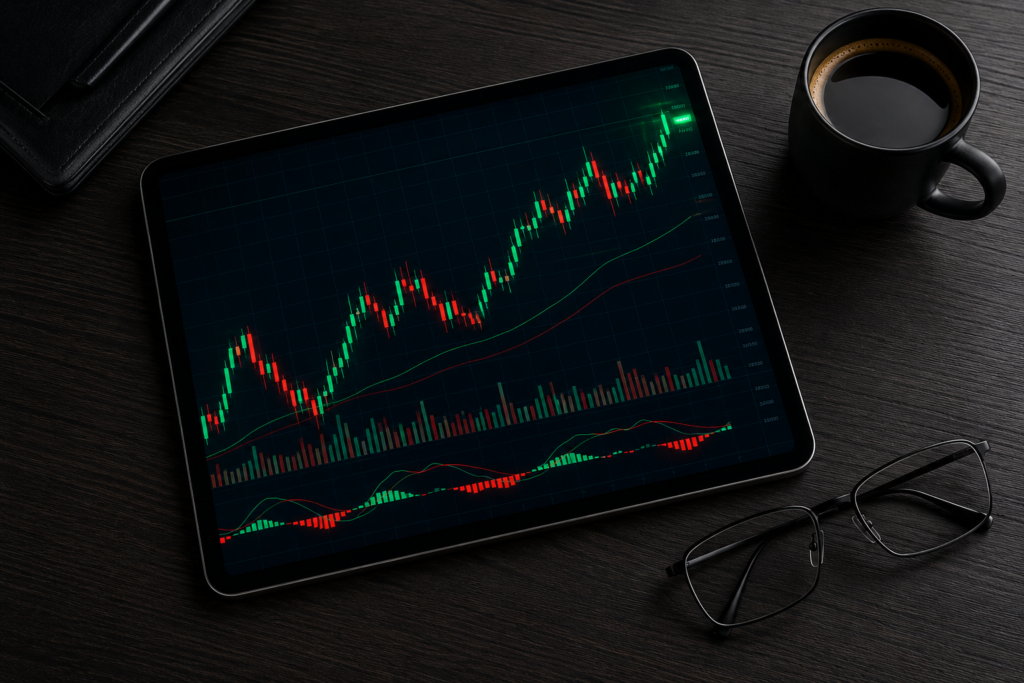
Each individual “candle” tells a complete story about a specific block of time, consisting of two main parts:
The Real Body
The thick rectangular middle section is the body. It measures the exact distance between the opening price and the closing price for that time period.
- Green Candle (Bullish): The closing price was higher than the opening price. Buyers controlled the market.
- Red Candle (Bearish): The closing price was lower than the opening price. Sellers controlled the market.
The Wicks (Shadows)
The thin lines poking out of the top and bottom of the body are called wicks. They represent the absolute highest and lowest prices the asset reached during that specific timeframe before settling at the closing price.
3. Identifying Market Trends
The first rule of technical analysis is to never fight the trend. The market generally moves in three distinct structural phases:
- Uptrend (Bullish): The price is actively climbing, visually characterized by a series of Higher Highs (HH) and Higher Lows (HL). This indicates strong buying pressure.
- Downtrend (Bearish): The price is steadily losing value, forming a series of Lower Highs (LH) and Lower Lows (LL).
- Sideways (Consolidation): The price is trapped in a horizontal range, bouncing between a set floor and ceiling without clear directional momentum.
4. Validating Moves with Trading Volume
Look at the bottom of your crypto chart, and you will see a row of vertical bars. This is the trading volume indicator. Volume tells you how much of a specific cryptocurrency was bought and sold during a given period.
Volume is the ultimate lie detector in crypto trading. If a cryptocurrency suddenly breaks out into a massive uptrend, but the volume bars remain tiny and flat, it means very few people are actually participating in the rally. This is often a “fake-out.” Conversely, a price breakout accompanied by a massive spike in trading volume validates the move, showing that major market players are heavily involved.
Final Thoughts for Beginners
Learning how to read crypto charts takes time and practice. Don’t overwhelm yourself by trying to memorize fifty different complex crypto chart patterns on day one. Start by setting your chart to a daily timeframe, mastering the anatomy of basic candlesticks, and learning to draw simple trend lines.
Disclaimer: Cryptocurrency markets are highly volatile. This guide is for educational purposes only and does not constitute financial advice. Always do your own research before investing.